Over the past two months, Bitcoin (BTC) has respected an ascending triangle formation, bouncing multiple times from its support and resistance lines. While this might sound like a positive, the price is still down 11% year-to-date. As a comparison, the Bloomberg Commodity Index (BCOM) gained 29% in the same period.
Bitcoin/USD 1-day chart at FTX. Source: TradingView
The broader commodity index benefited from price increases in crude oil, natural gas, corn, wheat and lean hogs. Meanwhile, the total cryptocurrency market capitalization was unable to break the $2 trillion resistance level and currently stands at $1.98 trillion.
In addition to 40-year record high inflation in the United States, a $1.5 trillion spending bill was approved on March 15, enough to fund the government through September. Worsening macroeconomic conditions pressured the supply curve, which, in turn, pushed commodities prices even higher.
For these reasons, cryptocurrency traders are increasingly concerned about the U.S. Federal Reserve rate hikes expected throughout 2022 to contain inflationary pressure.
If the global economies enter a recession, investors will seek protection in U.S. Treasuries and the U.S. dollar, itself, moving away from risk-on asset classes like cryptocurrencies.
Bulls placed their bets at $100,000 and higher
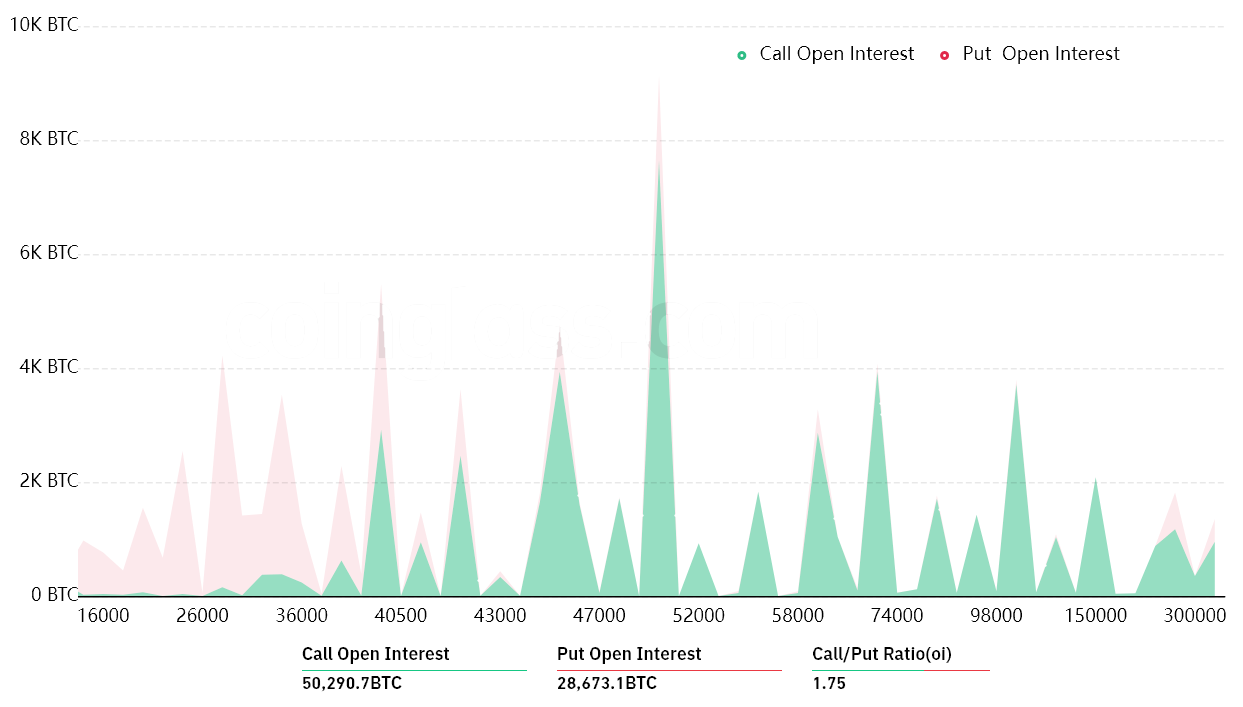
The open interest for the March 25 options expiry in Bitcoin is $3.34 billion, but the actual figure will be much lower since bulls were overly-optimistic.
These traders might have been fooled by the short-lived pop to $45,000 on March 2, as their bets for March 25’s options expiry extend beyond $100,000.
Even Bitcoin’s recent rally above $42,000 took bears by surprise because only 16% of the bearish option bets for March 25 have been placed above this price level.
Bitcoin options aggregate open interest for March 25. Source: CoinGlass
The 1.75 call-to-put ratio shows more sizable bets because the call (buy) open interest stands at $2.13 billion against the $1.21 billion put (sell) options. Nevertheless, as Bitcoin stands near $42,000, most bearish bets will likely become worthless.
For instance, if Bitcoin’s price remains above $42,000 at 8:00 am UTC on March 25, only $192 million worth of these put (sell) options will be available. This difference happens because there is no use in a right to sell Bitcoin at $40,000 if it trades above that level on expiry.
Bulls are aiming for a $280 million profit
Below are the three most likely scenarios based on the current price action. The number of options contracts available on March 25 for call (bull) and put (bear) instruments varies, depending on the expiry price. The imbalance favoring each side constitutes the theoretical profit:
Between $39,000 and $42,000: 6,300 calls vs. 6,300 puts. The net result is balanced between the call (bull) and put (bear) instruments.
Between $42,000 and $44,000: 8,700 calls vs. 4,600 puts. The net result favors bulls by $175 million.
Between $44,000 and $45,000: 10,600 calls vs. 4,300 puts. Bulls boost their gains to $280 million.
This crude estimate considers the put options used in bearish bets and the call options exclusively in neutral-to-bullish trades. Even so, this oversimplification disregards more complex investment strategies.
For example, a trader could have sold a put option, effectively gaining positive exposure to Bitcoin above a specific price, but unfortunately, there’s no easy way to estimate this effect.
Bitcoin bears need to pressure the price below $42,000 on March 25 to avoid a $175 million loss. On the other hand, the bulls’ best case scenario requires a push above $44,000 to increase their gains to $280 million.
Bitcoin bears had $150 million leverage short positions liquidated on March 22, so they should have less margin required to drive Bitcoin price lower. With this said, bulls will undoubtedly try to defend $42,000 until the March 25 options expiry.
The views and opinions expressed here are solely those of the author and do not necessarily reflect the views of Cointelegraph. Every investment and trading move involves risk. You should conduct your own research when making a decision.
Stronghold Digital Mining (SDIG), a crypto mining company in Pennsylvania, is turning waste from old power plants into energy to power hundreds of Bitcoin mining rigs.
The company collects coal refuse, a leftover waste material from the process of coal mining, and burns it in what it says is an emissions-controlled environment at its energy generation facilities.
Coal refuse can cause a raft of environmental problems, such as water and air pollution, and acid mine drainage, the acidic water which comes from coal mining operations. Collecting this waste and safely disposing of it while generating power for crypto mining is a productive way of tackling the problem.
The state of Pennsylvania is the third-largest producer of coal in the United States, estimates put the amount of coal wastage at 881 pounds per 2,200 pounds mined, or 400 kilograms per ton. Stronghold estimates that Pennsylvania alone has over 220 million tons of harmful wastage.
Bitcoin and other proof-of-work cryptocurrencies have caught the attention of regulators recently due to their reliance on energy-intensive processes in order to mine and provide validation for the network.
Earlier this month, a New York state proposal to suspend proof-of-work mining that uses fossil fuels was introduced, citing the negative environmental impact of the process, that proposal today was advanced by the New York State Assembly. If passed, it could see proof-of-work mining suspended for up to 3 years in New York.
Other schemes have seen ways to make Bitcoin mining environmentally friendly. Earlier this month, oil drilling company ConocoPhillips started a program in North Dakota where it would sell the natural gas byproduct from its operations to Bitcoin miners instead of burning it.
Ethereum Classic (ETC) price climbed on March 22, ignoring a deadly “death cross” on the weekly chart, as traders raised their bets on its potential to become a haven for miners fleeing the rival Ethereum blockchain.
ETC’s price jumped over 15.5% to reach $44 a token for the first time since Dec. 9, 2021. The coin’s intraday gains came as a part of a broader rebound move that saw its price rallying more than 75% eight days after bottoming out near $25.
ETC/USD daily price chart. Source: TradingView
Most of ETC’s course to the upside saw it tracking general crypto market trends. For instance, the Ethereum Classic token showed an extremely higher correlation with Bitcoin (BTC), the leading cryptocurrency by market cap, reaching 0.98 on multiple occasions.
A correlation coefficient reading of 1 between the two assets show that they move completely in lockstep.
ETC/USD versus BTC/USD correlation coefficient. Source: TradingView
But ETC’s 75%-plus gains in the last eight days largely outperformed BTC’s 15.5% returns in the same period. That may have to do with speculations about Ethereum Classic’s ability to attract miners from its rival Ethereum.
A “viable alternative” to Ethereum miners?
Ethereum Classic, however, failed to attract as many users by comparison, leaving the network in the hands of few miners. This resulted in a double spend attack worth $1 million on Coinbase in January 2019 and other instances of 51% attacks on the network.
In December 2020, Cardano founder Charles Hoskinson later announced that his firm, IOHK, initiated the Mantis project to upgrade Ethereum Classic and support its community.
Last year, the cooperative noted that “Ethereum’s move to Proof-of-Stake and Sharding may disrupt many in the community who prefer PoW and a strong base-layer approach to blockchain security,” adding:
“This is where #EthereumClassic becomes a viable alternative for #Ethereum projects to migrate to.”
As ETC rallies in March, the hash rate has not risen to new all-time highs, suggesting that miners aren’t jumping over just yet. Nevertheless, social media has started to take up the miner exodus mantra, as shown in the tweets below.
ETC is rising because its tech. indicators turned bullish on 3/18. Also, $ETH will go #PoS in few months, hence #ETC stands to benefit from increased hashrate and security, as miners look for alternatives.
ETC’s price also surged in the run-up to its third block reward reduction, or “fifthening,” expected to arrive on April 15, 2022 at block 15,000,000.
In detail, the Ethereum Classic’s block rewards get cut periodically by 20% every five million blocks (roughly every 2.5 years), following the improvement proposal ECP-1017, launched in 2017.
The last of such events occurred on March 16, 2020, which followed up with ETC rising by more than 350% to date.
Technically, ETC appears oversold due to its daily relative strength index rising above 70, a sell signal. The ETC/USD pair now tests $44 as its interim resistance, a level with a history of acting as a strong support between July 2021 and December 2021.
ETC/USD daily price chart. Source: TradingView
As a result, ETC may correct towards its 200-day exponential moving average (200-day EMA) near $37 next. Conversely, a decisive move above $44 could have it eye $50 — a psychological resistance level — as its interim upside target.
The views and opinions expressed here are solely those of the author and do not necessarily reflect the views of Cointelegraph.com. Every investment and trading move involves risk, you should conduct your own research when making a decision.
Founder of major crypto investment firm DeFiance Capital, “Arthur_0x”, has suffered a hack on one of his hot wallets resulting in the loss of more than $1.6 million in nonfungible tokens (NFTs) and crypto.
In a tremendous show of support, the crypto community has come to his aid to help retrieve the stolen items as he asked people to blacklist the hacker’s wallet. Several individuals on Twitter have attempted to determine exactly how the hack occurred and where the hacker gained access to his wallets.
NFT community member “Cirrus” went as far as buying two of the stolen Azuki NFTs and deciding to return them to Arthur at cost. Cirrus told Cointelegraph today that he:
“found out they were hacked, and instead of selling them for profit like the other folks who got some of his, decided I’d sell them back to him at cost to help him out.”
Cirrus added that this “isn’t the first time” this has happened to him. He said, “I could easily go sell them for 6-8 ETH profit, but it just isn’t right.” His profile states that he has been a victim of rug pulls three times before, which likely guided his sympathies for his fellow victim.
A rug pull is when a crypto or NFT project suddenly closes down and the value of their token or NFT plummets without prior warning. In most cases, rug pulls are confirmations of a scam.
In total, Arthur appears to have lost 78 different NFTs from five collections, mostly Azukis. He also lost 68 Wrapped Ether (WETH), 4,349 Staked DYDX (stkDYDX), and 1,578 LooksRare (LOOKS) tokens. The hacker began moving assets at about 12:30 am UTC, then promptly put all the NFTs up for bid on the OpenSea NFT marketplace. As of the time of writing, the hacker’s wallet held 545 ETH worth about $1.6 million.
This hack highlights the importance of operational security when dealing with the self-custody of crypto assets because even people in the highest echelons of the industry can be attacked. In Arthur’s case, he is baffled by how this happened to him as he wrote in a tweet “Hot wallet on mobile phone is indeed not safe enough.”
Was pretty careful and stuck with only using hardware wallet on PC until I start trading NFT more regularly.
Hot wallet on mobile phone is indeed not safe enough
Had Arthur used a hardware wallet, otherwise known as a cold wallet, he still may not have been protected from this attack. Unlike a hot wallet, a hardware wallet is not always connected to the network. This feature can keep one’s private key and seed phrase safe from intrusion. However, Arthur believes the security breach happened due to a transaction he made on-chain which may also have compromised the seed phrase or private key from a hardware wallet.
NFT and crypto scams are always a danger, so investors should take the highest security precautions with their assets. There are even serial scammers who design projects to take advantage of the NFT community and pull the rug then move on to the next scam. As Cirrus pointed out:
“This is a gold rush for hackers and they’re doing everything they can to come up with new ways to take advantage.”
In light of the frustration and irritation at the hack, Arthur had stern words for the party who stole his assets, stating in a tweet, “The only thing I can say to the hacker is: you mess with the wrong person.”
Ethereum co-founder Vitalik Buterin recently spoke about his biggest concerns regarding the crypto industry with Time magazine. Following the interview’s publication, Buterin responded to tweets that negatively compared his appearance to that of Tom Brady, NFL star and founder of the nonfungible token (NFT) marketplace Autograph.
The quote tweets on the new time article about me are truly amazing.
Buterin viewed the critical comments as comical and even posted collages of the “highly recommended” tweets. He admitted he didn’t know who Tom Brady was, thinking he was being associated with actor Tom Cruise at first. That’s when Brady, who knew exactly who Buterin was, chimed in to express his gratitude and fandom toward the “prince of crypto.”
What’s up Vitalik! You may not know me but just wanted to say I’m a big fan of yours. thank you for everything you’ve built in the world of crypto, otherwise @Autograph wouldn’t have been possible. Hope I get to meet you some day you’re the https://t.co/W6PxS5P78M
Brady praised Buterin as the G.O.A.T., a term used to describe those who are the “Greatest Of All Time” in their field and often used in reference to Brady for being the only NFL player with seven championships under his belt. Brady acknowledged that Autograph “wouldn’t have been possible” without Buterin. Recently, Autograph closed on a $170-million funding round. Company representatives stated at the time that it planned to use the funds to scale its NFT technology and expand its user base.
Buterin’s cover story is part of Time’s first-ever entire issue released as an NFT on the blockchain. The decentralized magazine edition will be available on Wednesday. As part of the magazine’s push for Web3 initiatives, it began accepting payment for digital subscriptions in Bitcoin (BTC), Ether (ETH), XRP, Dogecoin (DOGE) and other cryptocurrencies. TIMEPieces, the NFT arm of the company, tweeted on Sunday that it will soon add ApeCoin (APE), the governance and utility token of the Bored Ape Yacht Club, to its list of accepted cryptocurrencies.
Buterin referred to BAYC during the interview when discussing the tendency of those within the industry to publicly display wealth associated with crypto and NFTs. “The peril is you have these $3 million monkeys and it becomes a different kind of gambling,” he said.
Despite being unimpressed with public figures like Paris Hilton and Jimmy Fallon shilling their own Bored Apes or people “just buying yachts and Lambos,” Buterin did admit to “one silver lining.” Russian-born Buterin wrote to Time that all of the recent blockchain-based efforts to aid the Russia–Ukraine crisis have served to remind the crypto community “that ultimately the goal of crypto is not to play games with million-dollar pictures of monkeys, it’s to do things that accomplish meaningful effects in the real world.”
The Li Finance swap aggregator has experienced a smart contract exploit leading to the loss of around $600,000 from 29 users’ wallets.
The exploit took place at 2:51 am UTC on March 20. The attacker was able to extract varying amounts of 10 different tokens from wallets that had given “infinite approval” to the Li Finance protocol. Among the stolen tokens were USD Coin (USDC), Polygon (MATIC), Rocket Pool (RPL), Gnosis (GNO), Tether (USDT), Metaverse Index (MVI), Audius (AUDIO), AAVE (AAVE), Jarvis Reward Token (JRT), and DAI (DAI).
TLDR:
• ~$600K have been stolen from 29 wallets • User don’t have to do anything • Bug has been fixed and is already deployedhttps://t.co/fqOxJxDrZs
— LI.FI – Any-2-Any Swaps (,) (@lifiprotocol) March 21, 2022
When the team learned about the exploit 12 hours later at 2:15 pm UTC, it shut down all swapping functions on the platform in order to prevent any further losses.
By 2:50 am UTC on March 21, the team had issued a post mortem detailing the events of the exploit. The team said that the attacker swapped the stolen tokens for a total of about 205 Ether (ETH) valued at roughly $600,000. At the time of writing, the stolen ETH had yet to be moved from the attacker’s wallet. LiFi also assured users that the bug has been identified and patched.
Today’s LiFi hack happed because its internal swap() function would call out to any address using whatever message the attacker passed in. This allowed the attacker to have the contract transferFrom() out the funds from anyone who had approved the contract. pic.twitter.com/NA3xW7ReUd
Of the 29 wallets that were hit in this attack, 25 have been reimbursed from treasury funds for their losses. Those 25 wallets only accounted for $80,000, or 13% of the total value lost. The owners of the remaining four wallets that lost a combined $517,000 have been contacted and offered a deal to compensate them by honoring their losses as angel investors in the protocol.
They would receive LiFi tokens under the same terms as other angel investors in an amount equal to their losses from each wallet. This would also help to mitigate the damage to the platform’s treasury.
The hacker was also contacted and offered a bug bounty to return the funds.
The Li Finance team reached out to offer a bug bounty to a hacker.
The attack appears to have come at an unfortunate time. Li Finance CEO Philipp Zentner told Cointelegraph on March 21 that “We’re literally a week away from our audit,” adding that “we have multiple companies auditing us.”
However, even a thorough audit of the code may not have picked up this particular bug, according to a researcher “Transmissions11” at crypto investment firm Paradigm. He explained in a March 21 tweet that the error in Li Finance’s code is easy to miss and “subtle if you’re not in the right mindset.”
This latest hack in the decentralized finance (DeFi) sector demonstrates how giving infinite approvals to smart contracts opens a user’s funds to a greater amount of risk. Infinite approvals allow users to swap coins at a decentralized exchange (DEX) an unlimited amount of times without needing to approve any more transactions.
Cointelegraph is following the development of an entirely new blockchain from inception to mainnet and beyond through its series, Inside the Blockchain Developer’s Mind, written by Andrew Levine of Koinos Group.
We recently released the third and final version of the Koinos testnet, which is why I want to talk about something few projects like to talk about: Building blockchains is development hell. In this article, I’ll explain why and how other developers can avoid getting stuck in it.
At first blush, building a blockchain doesn’t sound so hard. A blockchain is just a combination of well-established cryptographic primitives, which, when properly implemented, allow for the construction of a ledger containing a verifiable history of transactions by a network. The more decentralized the network, the more trustworthy the history.
Blockchain “frameworks”
In an effort to make building new blockchains easier, other teams have released blockchain “frameworks” that, in theory, should eliminate the need for developers to worry about building the blockchain itself so that they can focus on whatever unique features they want to build into the blockchain. Cosmos, EOSIO and Polkadot’s Substrate are examples of such blockchain frameworks.
When our team stopped working on Steem (the world’s first fee-less blockchain), our original intention was to leverage an existing blockchain framework to build a blockchain designed to be as accessible as possible. We had spent four years refining Steem’s fee-less design and figured that, by porting that solution into an existing blockchain framework, we could deliver a blockchain that was far more accessible than any other blockchain in relatively little time.
But we were surprised to find that none of the existing frameworks allowed us to create the kind of truly feeless user experience we were looking to bring to the market. We didn’t just want to remove fees on a technical level, we wanted to empower developers to build applications that were free to use. They also lacked a number of other features we believed were required to deliver an acceptable developer experience.
The power of a general-purpose blockchain stems not from the features the blockchain engineers build into the blockchain but from the features that developers add to that blockchain as smart contracts. This is doubly true for a blockchain framework that should really be the mostgeneral-purpose blockchain imaginable since the whole idea is to allow people to build any kind of blockchain they can imagine. And yet, the existing frameworks failed to empower us, one of the most experienced blockchain development teams, in our attempts to build the blockchain we wanted to build in multiple ways.
The existing frameworks not only made it impossible for developers to create free-to-use applications, but they also forced developers to learn new and often difficult programming languages and dramatically restricted the rate at which both applications and the blockchain itself could improve.
We wanted to build a blockchain that would free developers to build insanely great applications that ordinary people would love to use. That allowed the developers to work in the programming languages they already knew and loved (what we call “universal language support”); that allowed their applications (and the blockchain itself) to rapidly evolve; and, most importantly, it allowed them to build applications that were free to use.
But in order to build thatblockchain we first needed a truly general-purpose blockchain frameworkthat would not only allow us to build the blockchain of our dreams but as a natural consequence of being the most general-purpose framework imaginable, should allow anyone to build the blockchain of theirdreams.
Koinos is that ultimate general-purpose blockchain framework that will serve as the foundation for the ultimate feeless layer 1: Koinos mainnet. The Koinos Blockchain Framework (KBF) is designed to be the simplestblockchain imaginable, containing only those cryptographic primitives necessary to construct a blockchain and the right “system calls” to allow for the widest range of behaviors to be added in-band (without a hard fork) through the uploading of a smart contract.
Infinite upgradeability
The benefit of this design is infinite upgradeability, but the cost is that it makes getting the system calls right all the more important. Missing a system call or designing it incorrectly would mean having to deal with an otherwise avoidable hard fork. Because hard forks are so time-consuming, political and disruptive, they are the single biggest factor limiting a blockchain’s ability to improve itself, which is ultimately felt by every single developer whose application is built on such a platform.
Now we can see how both application and blockchain developers can get trapped in development hell: working in programming languages they aren’t comfortable with, on platforms that force them to incorporate fees and that improve at a snail’s pace. Under these conditions, even minor changes have incredibly high stakes, and we haven’t even factored in those scenarios where there are millions, sometimes billions, of dollars at risk.
That is development hell. As the core development team behind the Steem blockchain that had to oversee 23 hard forks, we know this terrain better than almost anyone else, which is why we were so committed to banishing it, well … to hell.
Building the Koinos Blockchain Framework from scratch with an entirely novel microservice architecture and getting it to the point where we could launch versions 1 and 2 of the testnet were incredibly challenging. But integrating the feedback we got from those testnets, fixing the bugs they exposed, and finalizing the all-important system calls were a whole other level. But we went through that development hell with the hopes of making it so that others won’t ever have to.
Harbinger
Testnet v3 is, therefore, more than “just another” version of the testnet. It is the final version of the Koinos Blockchain Framework, which is why we will now refer to the testnet, not by a version number, but by the name: Harbinger. It is the culmination of nearly two years of working, identifying and implementing all the necessary system calls needed to give blockchain developers the ultimate level of freedom and allow their application developers to benefit from a platform that is improving at a more rapid rate than any other blockchain out there.
Of course, whenever you’re trying to solve a really important problem, some level of development hell is inevitable. You just want to make sure that you don’t adopt technologies that raise the stakes unnecessarily and that the goal you’re striving for is worth the cost.
For us, that goal is not only sparing blockchain developers (including ourselves) from countless hours spent in developer hell but also leveraging this new technology to build Koinos mainnet: the ultimate feeless layer 1 for empowering developers to build insanely great blockchain-based applications.
No more development hell
The KBF aims to eliminate development hell by allowing developers to build any blockchain they can imagine simply by writing smart contracts, which is infinitely easier than working in the blockchain code itself. And that’s exactly the position we find ourselves in now. While developing the blockchain framework was incredibly challenging, now that it’s over, all that is needed to complete Koinos mainnet is just twosmart contracts: one for our proof-of-burn consensus algorithm and the other for governance.
Not only is writing smart contracts far simpler than blockchain development, but this also means that blockchain developers now get to take advantage of the ever-expanding tools that are available to smart contract developers like the AssemblyScript SDK one of our community members built. AssemblyScript doesn’t just produce far more efficient smart contracts than those written in C++ (that was a surprise), it makes smart contract development accessible to JavaScript developers.
Since the KBF turns any smart contract developer into a potential blockchain developer, this means that developing custom blockchains will now be accessible to JavaScript developers with even more languages to come, such as Rust.
If you’re interested in running Harbinger, we’ve made it insanely easy to run a node so you can be up and running in under five minutes.
This article does not contain investment advice or recommendations. Every investment and trading move involves risk, and readers should conduct their own research when making a decision.
The views, thoughts and opinions expressed here are the author’s alone and do not necessarily reflect or represent the views and opinions of Cointelegraph.
Andrew Levine is the CEO of Koinos Group, a team of industry veterans accelerating decentralization through accessible blockchain technology. Their foundational product is Koinos, a feeless and infinitely upgradeable blockchain with universal language support.
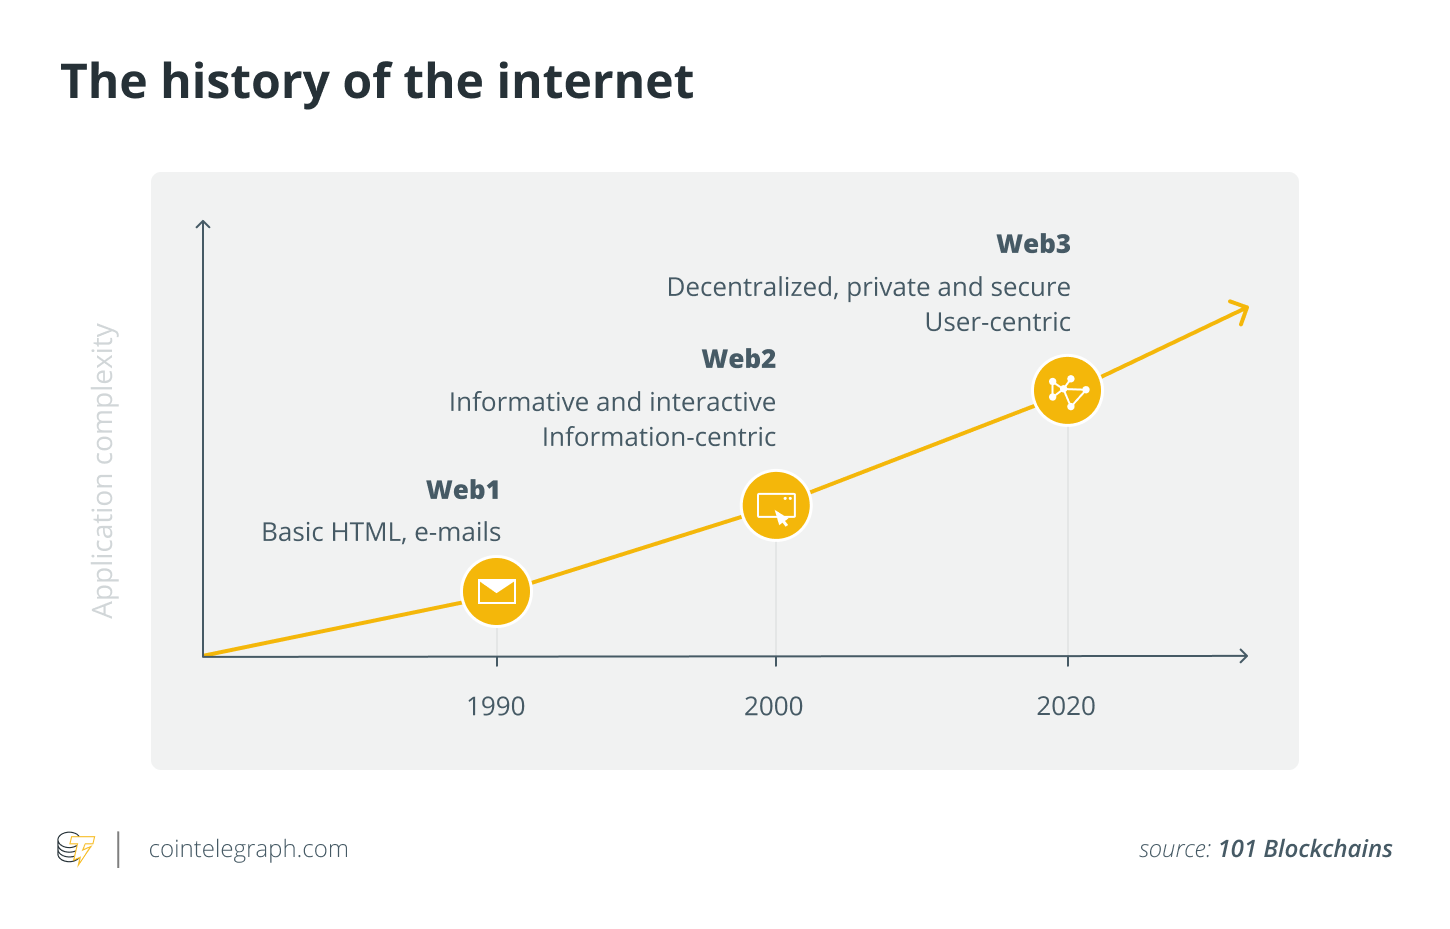
Content constitutes the essence of the internet and comes in many different forms that the current Web2 internet iteration supports — text, audio, video or a mix of all three. However, content is scarcely a free resource. It is content creators who are now becoming opinion leaders, influencers and the cornerstones of so many of the critical services businesses rely on, such as advertising, marketing and public relations management.
The need for content and its strive for independence — embodied by thousands of bloggers and indie performers — has spawned an immense online economy that trades talent and often rakes in sales volumes many a top-level artist would salivate to earn. This economy has been dubbed the creator economy: a financial framework that allows independent individuals to earn on their self-expression by feeding audiences the type of content they are willing to pay to consume.
A rising force
The creator economy is a tremendous force: a unique, online phenomenon that overstepped the $104-billion market size threshold at the end of 2021. Given the snowballing demand for new content on popular platforms, such as TikTok, that empower independent artists and performers, experts are hesitant to make forecasts about the potential market size of the creator economy in the near future.
The reason for the lack of tangible predictions is that the creator economy is an extremely young phenomenon that started with the COVID-19 pandemic. The lockdowns evoked a wave of talent among people confined indoors, resulting in a release of creativity that others sharing confinement were eager to consume as much-needed entertainment.
Considering that micro-entrepreneur creators are closely related to influencer marketing, which spots around $13.8 billion in market size, it is possible to understand the prospects that further expansion of the phenomenon can yield. More importantly, experts believe the transition to a new technological medium will allow content creators to overwhelm markets and industries with new opportunities for product and service promotion.
Decentralizing talent
More than 50 million creators are driving their own economy of talent, attracting in excess of $800 million in venture capital. Such figures are but a shadow of what they can become later, as new venues are rapidly becoming available.
The development of blockchain technologies has resulted in a sweeping revolution across financial markets, empowering individuals instead of institutions and channeling ownership of data and funds to their holders. The qualities of the blockchain — immutability, full transparency and the trustless nature of operations — have permeated many industries, swooning the balance of business orientation from centralized corporate reliance to decentralization. This shift in the basic concepts that govern relations between participants to transactions, facilitated by smart contracts, has not gone unnoticed in the creator economy.
With the decentralized finance and GameFi sectors marshaling across their respective industries and detracting droves of users from conventional approaches to banking and gaming, it was only a matter of time before influencers and content creators decided to shift the paradigm in their operating environments. The content creation model has been altered forever with the incorporation of blockchain technologies that allow users to incentivize content creators, while creators can actually monetize their talent without having to share the proceeds with centralized, often-unfair hosting platforms.
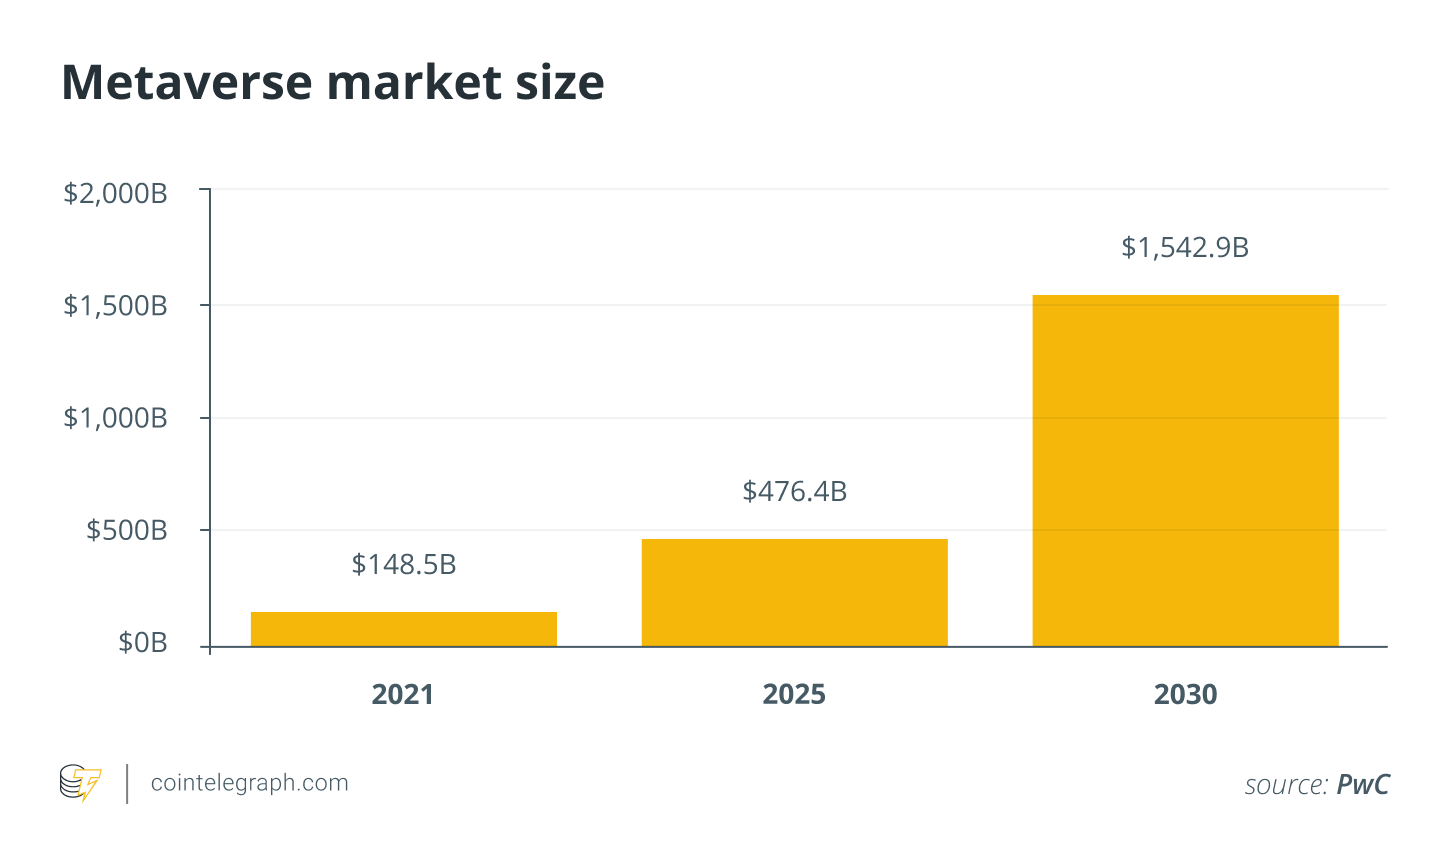
The development of metaverses — fully digital environments powered by the blockchain on Web3 and virtual reality — will herald a new era in content creation. Never before has talent had access to such an advanced set of tools to embellish even the bravest of ideas on the threshold of the real and digital worlds.
Metaverses allow creators to visualize in stunning graphical detail anything from an opera concert in the void of space against a backdrop of nebulae to a blog stream on a deserted island. Anything creativity can fathom can be implemented in the metaverse for the benefit of all parties involved. By relying on the unlimited opportunities of the metaverse in its incorporation of virtual reality, content creators will be able to unleash their creativity and allow it to roam wild. Such promises of unseen quality of content can only be described as honeysuckle for an eager audience of viewers longing for more variety in types of content consumed — and, more importantly, new experiences.
The blockchain basis of the metaverse offers even more benefits for content creators, as it allows them to employ various mechanisms for monetizing their content through the versatile nature of internal cryptocurrencies. Users can stake their digital assets on specific creators, encouraging them to release more content of a certain type. Others can pay to access special content, while others can simply reward their favorite creators with donations. The monetization avenues are numerous, and content creators can always be sure that their talent will be paid for and no hosting platform can strip them of their earnings.
Even more lucrative are the prospects for businesses in terms of content-creator economy permeation in the metaverse. Marketing, advertising and promotion in general gain a new lease on evolution with content that can be tailored in an endless variety of ways and seamlessly integrated into the channels of select creators. The metaverse provides businesses with an entirely new frontier for deployment and audience reach, and the creators are the takeoff ramps that can showcase products and services before their followers — for a price.
In digital hindsight
The metaverse is the next iteration of the internet we know today: a fully user-centric environment serving the purpose of elevating creativity to a new level. However, audiences will not be the only sources of revenue for content creators, as businesses are eager to tap into this lucrative niche and leverage the possibilities offered by native, organic and highly versatile ad integrations in virtual reality content.
This article does not contain investment advice or recommendations. Every investment and trading move involves risk, and readers should conduct their own research when making a decision.
The views, thoughts and opinions expressed here are the author’s alone and do not necessarily reflect or represent the views and opinions of Cointelegraph.
Johnny Lyu is the CEO of KuCoin, one of the largest cryptocurrency exchanges, which was launched in 2017. Before joining KuCoin, he had accumulated abundant experience in the e-commerce, auto and luxury industries.
Let’s say you want to lose your Bitcoin (BTC) totally, irretrievably and forever. Hey, it’s not our place to wonder why. Maybe it’s part of some elaborate performance art piece, like the guy who destroyed all his possessions or perhaps you’ve always been big fans of electronic music outfit The KLF, who famously burned 1 million pounds on a remote Scottish island. Or, your reason might be more mundane and you simply don’t want your soon-to-be-divorced spouse to get their share of the investment you both know you own.
Whatever your reason, we’re not here to judge. And, while we’re usually in the business of helping people protect their coins, it’s easy enough to reverse engineer security to help you lose them in the fastest and easiest way possible.
Brag about your Bitcoin
If you’ve got it and wish to lose it, flaunt it. Want to get rid of that Rolex weighing down your wrist? Pair it with a t-shirt, flash it about in a crowded bar and then take a walk through a bad part of town after dark — you’ll soon find yourself relieved of your timepiece.
It’s the same with Bitcoin. You want the world to know you’re a Bitcoiner and, ideally, that you’ve stacked enough sats for it to be worthwhile stealing them. So tell them. Add laser eyes to your social media profiles, keep tweeting those diamond hands and don’t forget about the offline world, either. Be sure to boast about your mastery of Bitcoin to all your friends, family and, most importantly, new acquaintances. You never know who will be tempted to start probing your defenses in order to relieve you of your investment.
In the early Wild West days of Bitcoin, losing your coin was child’s play, as there was no shortage of disreputable exchanges that would help you lose your investment. If you kept your coins in a hosted wallet, it was only a matter of time before the exchange went bust like Mt. Gox, got hacked, lost coins by engaging in fractional reserve banking or the owners absconded (or died) with your keys.
The exchange market has matured significantly in recent years, with enhanced security measures such as two-factor authentication and even published proof-of-reserves and proof-of-custody. Don’t be disheartened: As long as you entrust your keys to a third party, anythingcould happen — and probably will.
Exchanges still go bust with reassuring regularity. Even more encouragingly, governments are now actively targeting Bitcoiners’ wealth. And, not just traditional authoritarians like China and Russia, the Canadian government recently instructed financial institutions — including cryptocurrency custodians — to freeze the accounts of anyone who donates even a small amount to the “trucker protests.”
Deputy PM Chrystia Freeland: “The names of both individuals and entities as well as crypto wallets have been shared by the RCMP with financial institutions and accounts have been frozen and more accounts will be frozen.” pic.twitter.com/iA69DbRJl1
Even if you have a strong password and 2FA protecting your exchange account, you never know what other vulnerability might be exploited to gain access and drain it. If you’ve got your coins on-exchange, relax: They’re in unsafe hands.
Things get a little trickier if you’ve decided to self-custody your Bitcoin offline in a secure hardware wallet. Or do they? After all, when you hold the keys yourself, the power to lose your coins is completely in your hands. Why wait for an exchange to go bust when you can start adopting security “worst practice” today?
The secret to making your wallet insecure lies in your seed phrase, the string of words you use to generate your private key. The simplest way to lose your coins is to memorize your seed phrase and then delete or destroy any record of it. A few months on, hardly anyone has a hope of recalling every word in the correct order.
But, what if you’re cursed with an eidetic memory? Easy: Write it down. Even better, do it twice in physical pen-and-paper form, ideally kept near your hardware wallet. And, for good measure, record it in a cloud-based document where anyone with a will can access it through a brute-force attack. This is particularly effective if you regularly remind people you hold wealth in Bitcoin.
Disinherit the next generation
This one is for those who like playing the long game. You know the phrase “you can’t take it with you?” Well, with Bitcoin, you can. If you haven’t considered inheritance planning, then your entire investment will likely go to the grave with you, joining the estimated 3.7 million Bitcoin (around 18% of the coins there will ever be) that has already been lost forever.
Of course, this requires you to reverse the principles above: If you really want to cheat your children out of their inheritance, you need to make it as difficult for them to gain access to your keys as any attacker. So, if that’s the way you want to go, don’t tell your heirs, don’twrite down your seed phrase, and doget a hardware wallet. Even better, cut your 24-word seed phrase into many pieces and store them in many hidden holes around the world with no recovery instructions whatsoever. Your heirs won’t thank you at all.
Whatever you do, just make sure your Bitcoin storage and security providers don’t have a specific and robust protocol for inheritance planning. You can rest easy in the knowledge that not even the Devil himself will get your wealth when you pass on.
If, for some reason, you dowant to protect your Bitcoin, just ignore everything I’ve written. Even better, do the opposite. But, all you’d be doing is securing your investment in the only censorship-resistant and inflation-proof store of value ever invented. And, why would you want to go and do something as dull as that?
This article does not contain investment advice or recommendations. Every investment and trading move involves risk, and readers should conduct their own research when making a decision.
The views, thoughts and opinions expressed here are the author’s alone and do not necessarily reflect or represent the views and opinions of Cointelegraph.
Jameson Lopp has been actively building in the Bitcoin space since 2015 and has become one of the most respected voices in the Bitcoin developer community. He was previously an engineer at BitGo, developing its high-grade multisig custody service before joining Casa, a company providing secure wallets and plug-in-play infrastructure solutions for Bitcoin.
The proposed European Union Regulation on Markets in Crypto Assets, or MiCA, (hereinafter the “regulation”) was put to a vote in the European Union Parliament’s Committee on Economic and Monetary Affairs on March 14, 2022, and in the end, the proposed amendment to ban or restrict proof-of-work-based crypto assets, which would have effectively resulted in a ban on Bitcoin (BTC), was rejected.
The question of how crypto assets will be assessed from an environmental regulation perspective remains, however, with the Member of the European Parliament in charge of the text indicating that crypto assets will be included, like all other financial products, in the area of the union’s taxonomy (the process of classifying economic activities that have a favorable impact on the environment), without specifying the treatment of these assets in view of this taxonomy.
The proposed regulation is part of the digital finance package that also includes a proposal for a pilot scheme for market infrastructures based on distributed ledger technology (DLT) of interest to the security token sector, adopted by the Parliament’s Economic and Monetary Affairs Committee in January this year and due to come into force by the end of 2022.
The EU Commission has been considering several options for regulating the crypto asset sector. It finally chose the option of full harmonization within the EU of the rules applicable to issuers and service providers in crypto assets, with an EU passport, over the option of an opt-in regime to obtain the EU passport with the application of national regimes. For stablecoins, the Commission has favored a tailor-made legislative regime combined with regulation under the E-Money Directive.
Let us take stock of the main provisions of the MiCA Regulation, which, after the trialogue among the Council, the Parliament and the Commission following the vote on March 14, should also enter into force before the end of the year and which pursues four objectives: legal certainty, support for innovation, consumer and investor protection and market integrity, and financial stability.
In addition to determining the competent authorities and their administrative sanctioning powers, as well as the anti-market abuse rules, the main provisions of the Regulation relate to the purpose and scope of the Regulation (I), the rules applicable to the issuance of utility crypto assets (II), asset-referenced tokens (III), electronic money crypto assets (IV), and the rules applicable to crypto asset service providers (V).
I. Purpose and scope of the regulation
The purpose of the regulation is to establish rules concerning:
Transparency and disclosure requirements for the issuance and admission to trading of crypto assets.
The authorization and supervision of crypto asset service providers, issuers of asset-based tokens and issuers of electronic money tokens.
The operation, organization and governance of asset-based token issuers, electronic money token issuers and crypto asset service providers.
Consumer protection rules for the issuance, trading, exchange and custody of crypto-assets.
Measures to prevent market abuse in order to ensure the integrity of the crypto-asset markets.
The regulation applies to persons in the EU who issue crypto assets or provide services relating to crypto assets. The Regulation does not apply to:
rypto assets that are financial instruments (equity securities issued by companies with shares, debt securities, units or shares in collective investment undertakings and financial futures contracts) or electronic money except where the latter qualifies as electronic money tokens under the Regulation.
ertain entities or persons, such as the European Central Bank and the national central banks of the member states, insurance undertakings, a liquidator or administrator acting in insolvency proceedings, persons providing crypto asset services exclusively for their parent undertaking, their subsidiaries or other subsidiaries of their parent undertaking, the European Investment Bank, the European Investment Bank and public international organizations. Authorized credit institutions and investment firms will only be subject to certain provisions of the Regulation or will have the provisions governing them adapted.
II. Rules applicable to the issuance of crypto utilities
This category, which the Regulation calls “crypto-assets other than tokens referring to assets or electronic money tokens,” corresponds to crypto assets intended to provide digital access to a good or service, available on the DLT system, and which are only accepted by the issuer of this token (“utility tokens”). These “utility tokens” have a non-financial purpose related to the operation of a digital platform and digital services and should be considered as a special type of crypto asset. These may include cryptocurrencies such as Bitcoin, Ether (ETH) or Tezos (XTZ).
The Regulation prohibits offering to the public or seeking admission to trading on a trading venue crypto assets unless the issuer is a legal entity and a white paper complying with the Regulation has been prepared, notified to the competent authority and published.
Rules in terms of fair, honest and professional conduct and communications are provided for, as well as in terms of managing conflicts of interest and compliance with protocol security standards.
The obligation to produce a white paper does not apply when crypto assets are offered free of charge (which is not the case when buyers provide personal data or when the issuer receives payment of third-party fees, commissions or other benefits); are automatically created by mining or transaction validation; when they are unique and nonfungible (nonfungible tokens are, therefore, excluded from the obligation to publish a white paper); offered to fewer than 150 persons per member state; the amount of the offer does not exceed 1 million euro over a period of 12 months; or when the offer is reserved solely for qualified investors.
It should also be noted that the issuer of crypto assets must offer a right of withdrawal to the consumer, which can be exercised over a period of 14 calendar days.
III. Rules applicable to the issuance of asset-referenced tokens
This category of crypto assets consists of tokens that aim to maintain a stable value by referring to several legal tender currencies, one or more commodities, one or more crypto assets, or a basket of these assets. By stabilizing their value, these asset-based tokens are often intended to be used by their holders as a means of payment for the acquisition of goods or services and as a store of value.
An issuer wishing to offer or apply for admission to trading on a trading venue of asset tokens is required to obtain authorization from the competent authority of its home member state unless the average amount outstanding of the asset tokens does not exceed 5 million euro over a period of 12 months, or the offer is intended only for qualified investors.
The authorization gives access to the European passport. A white paper must be prepared.
Such an issuer is subject to a number of obligations, including those relating to marketing communications, conflicts of interest and governance: 350,000 or 2% of average reserve assets, whichever is higher.
These reserve assets must be prudently and efficiently managed, segregated from the issuer’s assets and entrusted to credit institutions or crypto asset service providers. These reserve assets may only be partially invested in highly liquid and low-risk financial instruments.
Furthermore, interest payments to holders of such tokens are prohibited.
Specific rules are provided for acquisitions of issuers of tokens referring to assets, including the obligation to notify the competent authority of the proposed acquisition, which may object to the acquisition.
Finally, there are additional obligations for issuers whose tokens refer to assets that are material. The European Banking Authority shall determine what tokens are material, for example, in view of the market capitalization of the tokens (such determination may also be requested voluntarily by the issuer).
IV. Rules applicable to the issuance of crypto assets of electronic money
This third category corresponds to crypto assets intended primarily as a means of payment with the aim of stabilizing their value by reference to a single fiat currency. Like e-money, these crypto assets are electronic substitutes for coins and banknotes and are used to make payments. They differ from e-money in that holders of e-money always have a claim on the e-money institution and have the contractual right to demand repayment of the e-money held, at any time and at face value, in legal tender fiat currency, which is not necessarily the case for e-money tokens.
The main obligation for the issuer of electronic money tokens is the authorization as a credit institution or as an electronic money institution within the meaning of Directive 2009/110/EC (hereinafter “Electronic Money Directive”), which it must obtain, as well as the publication of a white paper in accordance with the Regulation.
Such authorization and publication of a white paper will not be required if the electronic money tokens can only be held by qualified investors or if the average outstanding amount of tokens over 12 months does not exceed 5 million euro (or such lower threshold as may be set by a member state).
Holders of electronic money tokens have a claim on the issuer of the tokens. Electronic money tokens that do not confer a claim on all their holders are prohibited.
By way of derogation from the Electronic Money Directive, no issuer of electronic money tokens or provider of crypto asset services shall grant interest to the holders of such tokens.
Specific rules are provided for electronic money tokens of significant importance.
V. Rules applicable to providers of crypto asset services
Crypto asset services shall only be provided by legal persons who have their registered office in a member state of the union and who have been authorized as crypto asset service providers.
Authorization as a crypto asset service provider will be valid throughout the union and must enable crypto asset service providers to provide throughout the union the services for which they have been authorized, either under the right of establishment, including through a branch or under the freedom to provide services.
Crypto asset service providers will act honestly, fairly and professionally in the best interests of their clients and potential clients and will provide their clients with fair, clear and not misleading information, in particular in their commercial communications, which must be identified as such. Crypto asset service providers must warn their customers of the risks associated with the purchase of crypto assets. They must make their pricing policy available to the public by posting it in a prominent place on their website.
A crypto asset service provider must at all times have in place prudential safeguards in an amount at least equal to the higher of the following two amounts:
(a) The amount of the minimum ongoing capital requirement applicable to it, depending on the nature of the crypto asset services it provides, either:
For the services of reception and transmission of orders on behalf of third parties, advice on crypto assets, execution of orders on crypto assets on behalf of third parties and placement of crypto-assets: 50,000 euros.
For services of custody and administration of crypto assets on behalf of third parties: 125,000 euros.
For services of operating a platform for trading crypto assets, exchanging crypto assets for fiat currency or for other crypto assets: 150,000 euros.
(b) One-quarter of the previous year’s fixed overheads, which are recalculated annually.
There are a number of specific obligations depending on the crypto asset service. An acquisition regime for crypto asset service providers is also provided.
This article was co-authored by Thibault Verbiest and Jérémy Fluxman.
The views, thoughts and opinions expressed here are the authors’ alone and do not necessarily reflect or represent the views and opinions of Cointelegraph.
This article is for general information purposes and is not intended to be and should not be taken as legal advice.
Thibault Verbiest, an attorney in Paris and Brussels since 1993, is a partner with Metalaw, where he heads the department dedicated to fintech, digital banking and crypto finance. He is the co-author of several books, including the first book on blockchain in French. He acts as an expert with the European Blockchain Observatory and Forum and the World Bank. Thibault is also an entrepreneur, as he co-founded PayFoot. In 2020, he became the chairman of the IOUR Foundation, a public utility foundation aimed at promoting the adoption of a new internet, merging TCP/IP and blockchain.
Jérémy Fluxman has been an associate at international law firms in Paris and Luxembourg in the fields of private equity and investment funds, as well as at a Monaco law firm since 2017. He holds a Master II in international business law and is currently an associate at the Metalaw firm in Paris, France where he advises on fintech, blockchain and crypto finance.