Netflix’s new crypto documentary titled “Trust No One: The Hunt for the Crypto King” was released on 30 March amid much fanfare. The documentary is based on the mysterious death of the now defunct crypto exchange QuadrigaCX founder.
The founder of the crypto exchange allegedly died on a trip to India. Along with him, he took away the whereabouts of the keys to crypto wallets containing $250 million worth of cryptocurrencies.
Unofficial investigations and numerous conspiracy theories followed the mysterious disappearance/death of the QuadrigaCX founder. The Netflix investigative documentary aims to clear some mystery around the high-profile crypto case that puzzles many even today.
The crypto swindler documentary takes inspiration from “DON’T F*CK WITH CATS”-style investigative thriller and people already seemed to be hooked to the release. One Twitter user wrote:
“Watched it at the gym tonight. Got only 1/2 way through, but it’s already insane: Biggest red flag is faking death with Crohn’s disease, seriously?! You don’t need an MD to know Crohn’s disease rarely leads to death!”
A user who had allegedly used the QudrigaCX back in the day claimed that he smelled fishy behavior way early and took money out in time, after watching the documentary, he wrote:
“I had a lot of coins on that exchange. But one day I sensed something strange with the way the trades were being handled. Having set up bloomberg systems for AIMCO, i had a good feeling for how these exchanges should work. Right then and there I pulled all the coins out.”
While the investive documentary is quite engaging and doesn’t really require anyone to have any crypto knowledge to understand it, many in the crypto community who has closely covered the story or were affected by the bust of the exchange found it quite fulfilling.
Mike Oltoff, founder and CEO of Coin card claimed many of his friends played a cameo in the documentary including himself
“It’s so weird to see a bunch of my friends in a documentary, but they all did great! Funny enough, I cameo on this documentary too in the background of one of the videos about Patryn. “
Investors tend to not complain about a price rally, except when the chart presents steep downside risks. For example, analyzing Ether’s (ETH) current price chart could lead one to conclude that the ascending channel since March 15 is too aggressive.
Ether price at FTX, in USD. Source: TradingView
Thus, it is only natural for traders to fear that losing the $3,340 support could lead to a retest of the $3,100 level or a 12% correction down to $3,000. Of course this largely depends on how traders are positioned, along with the Ethereum network’s on-chain metrics.
For starters, the Ethereum network’s total value locked (TVL) peaked at ETH 32.8 million on Jan. 23, and has since gone down by 20%. TVL measures the number of coins deposited on smart contracts, including decentralized finance (DeFi), gaming, NFT marketplaces, social networks, collectibles and high risk.
Moreover, the Ethereum network’s average transaction fee bottomed at $8 on March 16, but has recently increased to $15. Thus, one must evaluate if that reflects lesser use of decentralized applications (DApps) or users benefiting from layer-2 scaling solutions.
Ether’s futures premium shows little excitement
Traders should analyze Ether futures market data to understand how professional traders are positioned. The quarterly contracts are whales and market makers’ preferred instruments because they avoid the fluctuating funding rate from the perpetual futures.
The basis indicator measures the difference between longer-term futures contracts and the current spot market levels. The Ether futures annualized premium should run between 5% to 12% to compensate traders for “locking in” the money for two to three months until the contract expiry.
The current 6% Ether futures basis sits slightly above the minimum threshold for a neutral market. An annualized futures premium below 5% is deemed bearish, while numbers above 12% indicate bullishness.
This data tells us that pro traders are far from excited but in the past couple of months there was a 4% or lower basis rate, which reflected bearish sentiment. Thus, there has been an improvement, but not enough to cause excessive demand from buyers.
To exclude externalities that might have influenced derivatives data, one should analyze the Ethereum network’s on-chain data. For example, monitoring the network use tells us whether actual use cases support the demand for Ether.
On-chain metrics raise concerns
Measuring the number of active addresses on the network provides a quick and reliable indicator of effective use. Of course, this metric could be misguided by the increasing adoption of layer-2 solutions, but it works as a starting point.
7-day average of active addresses on Ethereum. Source: CoinMetrics
The current 593,260 daily active addresses average is a 2% increase from 30 days ago, but it’s nowhere near the 857,520 seen in May 2021. Data shows that Ether token transactions are not showing signs of growth, at least on the primary layer.
Traders should proceed to DApp usage metrics but avoid exclusive focus on the TVL because that metric is heavily concentrated on lending platforms and decentralized exchanges (DEX), so gauging the number of active addresses provides a broader view.
Ethereum DApps saw an average monthly 11% decrease in active addresses. Overall, the data is disappointing because the smart contract network was specifically designed to host decentralized applications.
As a comparison, the DApps on the Polygon network gained 12% while Solana (SOL) saw a 6% user increase. Unless there is decent growth in Ether transactions and DApp usage, the $3,340 daily close support will probably unwind.
The views and opinions expressed here are solely those of the author and do not necessarily reflect the views of Cointelegraph. Every investment and trading move involves risk. You should conduct your own research when making a decision.
Bitcoin (BTC) may be consolidating at $47,000, but longer timeframes show just how significant this week’s mini bull run has been.
According to the Golden Ratio Multiplier (GRM) metric, on March 27, BTC/USD reclaimed an essential support zone for securing further upside.
Bitcoin exits trendline slump that beat March 2020
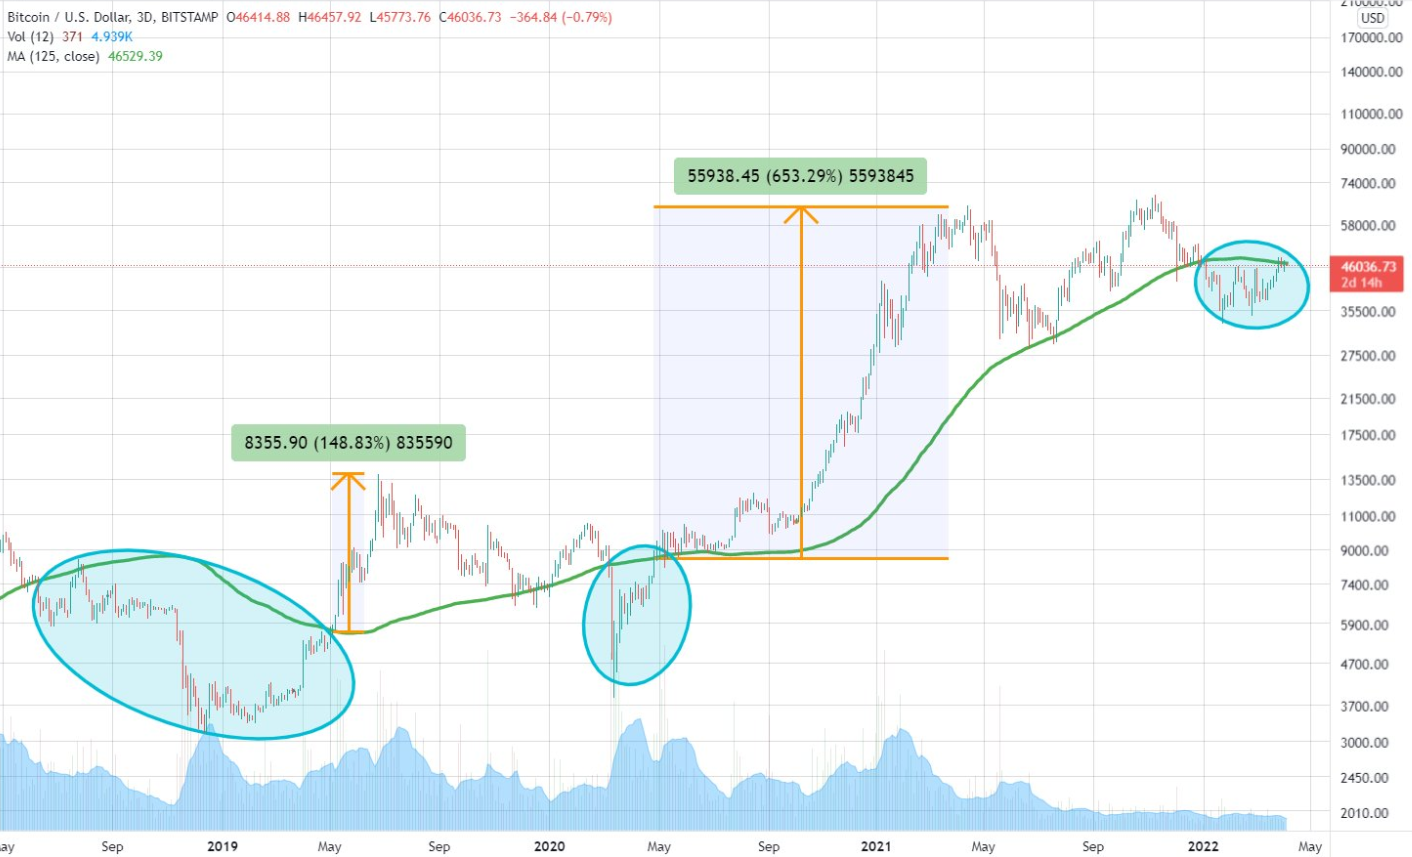
GRM is a long-term observational metric for Bitcoin price action. It is used to determine whether Bitcoin price growth (or the opposite) is overstretched relative to its overall maturity as an asset in terms of adoption.
It does so using a log scale, which comprises Bitcoin’s 350-day moving average (DMA) and Fibonacci sequences to give multiples of that trendline.
As such, BTC/USD dropping below the 350DMA is a now conspicuous sign of outlier price action, as the vast majority of days have been spent above it since mid-2019.
As Bitcoin matures and adoption spreads, logarithmic extremes become less pronounced.
“The Golden Ratio Multiplier is an effective tool because it is able to demonstrate when the market is likely overstretched within the context of Bitcoin’s adoption curve growth and market cycles,” analyst Philip Swift, who created the tool in 2019, explained at the time.
March 2020 COVID-19 crash, for example, had marked Bitcoin’s longest recent trip below the 350DMA, but 2022 managed to beat it by three months to two.
As such, the first three months of this year look like a clear exception to the rule when it comes to GRM.
Another use for GRM is naturally tied to predicting Bitcoin market cycle tops. In 2019, Swift estimated that the next top would be roughly three times the 350DMA.
“If this decreasing Fibonacci sequence pattern continues to play out as it has done over the course of the past 9 years, then the next market cycle high will be when price is in the area of the 350DMA x3,” he reasoned.
Bitcoin Golden Ratio Multiplier chart. Source: LookIntoBitcoin
Weekly chart makes mincemeat of once solid resistance
On mid-range timeframes, as Cointelegraph reported, Bitcoin is already making a statement when it comes to trendlines in place throughout 2022.
Two MAs providing resistance in Q1 — the 21-week and 50-week exponential MA — saw their first challenge this week, and bulls are currently battling for them as new support, data from Cointelegraph Markets Pro and TradingView shows.
The two roughly divide Bitcoin’s current trading range, in effect since the start of 2021, into two parts with $28,000 and $69,000 as the floor and ceiling, respectively.
Moving above them, popular trader and analyst Rekt Capital previously said, would allow BTC/USD to have a shot at new all-time highs.
“BTC has performed a Weekly Candle Close above the 21-week Bull Market EMA when price is in an uptrend for the first time since mid-July 2021,” he added in an update on the topic this week.
BTC/USD 1-week candle chart (Bitstamp) with 21-week and 50-week EMA. Source: TradingView
The views and opinions expressed here are solely those of the author and do not necessarily reflect the views of Cointelegraph.com. Every investment and trading move involves risk, you should conduct your own research when making a decision.
Fabio Panetta, an executive board member of the European Central Bank, said focus groups exploring the potential rollout of a digital euro hinted the ability to use the digital currency at online and physical stores could be a key feature.
In a written statement released Wednesday, Panetta broke down the findings of ECB focus groups on digital payment methods commissioned in September 2021, which suggested people were more likely to accept a digital euro accepted in physical and online stores and allowed easy person-to-person payments. According to Panetta, all merchants would need to accept a digital euro to see adoption trends like those the fiat euro experienced 20 years ago.
“The introduction of euro banknotes made it possible for us to pay with physical euros anywhere in the euro area,” said Panetta. “So it is no surprise that people expect to be able to use the digital complement to banknotes wherever they can pay digitally or online.”
Findings from the focus groups also hinted that many members of the general public and merchants were unfamiliar with a digital euro and feared that cash was being phased out as the number of use cases for the technology increased. However, once the concept was explained to them, members of the focus group from the general public said being “widely accepted in all kinds of physical shops and online” was the most desirable feature for a digital euro, while merchants suggested high demand would be their biggest driver.
A digital euro can only be successful if it meets the payment needs of Europeans, says Executive Board member Fabio Panetta. Focus groups have provided us with key input for the project.
Panetta added that the ECB would consider these features alongside concerns over privacy in response to the public consultations the central bank conducted between October 2020 and January 2021. He said the ECB would conduct another round of focus groups on the digital euro toward the end of 2022, providing data that could be used to determine relevant policies:
“We are getting a clearer picture of what citizens and merchants want, so we can finetune all the design features of a digital euro before any potential issuance. And co-legislators have a key role to play, for instance to enable greater privacy.”
The European Central Bank has been exploring the development of a digital euro as interest in central bank digital currencies seems to be growing across the world. The Central Bank of the Bahamas was the first nation to release a CBDC in October 2020. China began trials of its digital yuan in 2020, later making it available to international athletes at the Beijing Winter Olympics in February.
Solana (SOL) NFT holders will soon have a new option for where to trade, with OpenSea teasing its integration of the Solana blockchain.
A 16-second video shared by the OpenSea Twitter account opened with the phrase “wen solana???” being typed into a search box and revealed that Solana will be supported by the marketplace in April.
Rumors of OpenSea supporting Solana NFTs have circulated for months. Security researcher Jane Manchun Wong — who made Forbes 30 under 30 for her high profile tech leak scoops — shared images on Twitter in January she said were sourced from OpenSea’s platform.
The images show the marketplace’s “blockchains filter” listing Solana as an option and the Phantom Solana crypto wallet appearsg in a list of supported wallets.
OpenSea coyly replied to Wong’s tweet with a “wide eyes” emoji at the time, but didn’t outright confirm or deny the authenticity of the claim.
Many popular Solana NFT projects have announced their intention to list with OpenSea in April, including SolPunks, Turtles, Remnants and the Degenerate Ape Academy.
The Solana integration will pitch OpenSea in direct competition with Magic Eden, Solanart, and Solsea, the current leading NFT marketplaces on the Solana blockchain.
Mistake or hack? Bored Ape NFT sells for $140
An OpenSea user by the handle “cchan” has sold a Bored Ape NFT and a Mutant Ape NFT for a combined value of $140.
A user made offers on the NFTs which were accepted by cchan and the sales were made to the within a minute of each other on Monday, Mar. 28, with BAYC #835 sold for 115 DAI, and MAYC #11670 sold for 25 DAI which is 99% under the current floor price.
DAI is a US dollar stablecoin with a diamond logo and it’s unknown if cchan mistook the offers to be in Ethereum (ETH) which would’ve been the equivalent of $470,000, or if the sales weres the result of a hack.
Activity by the user who purchased the NFTs shows a history of offers being made in DAI on Bored and Mutant Ape NFTs, which some have suggested could be in the hopes that this exact set of circumstances would occur.
Silk Road Founder to launch new NFTs at Bitcoin Miami
Ross Ulbricht, the imprisoned founder of the defunct darknet marketplace “Silk Road” is set to release another collection of NFTs at the Bitcoin 2022 conference in Miami in April, with funds raised going toward helping children travel to visit their parents in prison.
In December 2021, Ulbricht auctioned a collection at the Art Basel Miami which netted him $6.2 million. The collection was purchased by FreeRossDAO, a decentralized autonomous organization that aims to “share Ross’s work with the world and give everyone a unique opportunity to own a piece of it.”
“All of this has brought a new spark to my life,” Ross wrote in a post, reflecting on the sale of his last collection.
“I have direction and purpose and I feel like I can make a difference again. The more money we raise, the more good we can do, so I have been busy creating my next art collection.”
Dubbed the “Growth Collection”, it will be minted on the Bitcoin blockchain via Counterparty, and the piece will reportedly feature four physical oil paintings and one hand-drawn animation, accompanied by five Bitcoin NFTs to be auctioned on the Scarce.City network.
Ulbricht is serving two life sentences without the possibility of parole for his part in creating the illicit online marketplace, which famously used Bitcoin as the means of transaction.
WWE and the Metaverse
The WWE has partnered with Fanatics, a sports marketing business which, amongst other offerings, enables brands to offer digital collectibles and NFTs to their audience.
The partnership will see Fanatics create “physical, digital, and non-fungible token (NFT) trading cards” for the WWE, with Fanatics to become the exclusive provider of licensed WWE physical and NFT trading cards, building a range featuring WWE’s “biggest moments and stars.”
Other Nifty News
Mark Karpelès, the former CEO of the defunct Mt. Gox exchange announced that users who used the exchange between 2010 and 2014 around the time it was hacked, are eligible to register for a free NFT in the hopes it will “erase a bit of the loss incurred in Mt. Gox.”
The Decentraland metaverse hosted the Metaverse Fashion Week between March 24-27, 2022, the event attracted over 70 big name fashion labels and artists such as Tommy Hilfiger, Dolce and Gabbana, and Estée Lauder.
This week Gnosis (GNO) price notched a swift 50%+ rally after the project took another step forward in its transition to the Coincidence of Wants Procotol, or CoW, an interface that offers traders protection from miner extracted value (MEV).
Data from Cointelegraph Markets Pro and TradingView shows that the price of GNO has gained 86% over the past seven days, rising from a low of $308 on March 21 to an intraday high at $574 on March 28.
GNO/USDT 4-hour chart. Source: TradingView
Three reasons for the rapid price increase for GNO are the release of the CowSwap (COW) token, which was airdropped to Gnosis holders, traders’ appreciation of the MEV-protection offered by the protocol and the potential for GNO holders to receive additional airdrops in the future.
COW drops!
The most recent price surge appears primarily connected to the official release of COW, the native token of the CowSwap protocol which offers traders MEV-protection.
$COW token is finally expected to unlock around 3pm UTC today.
This will kick off a 12 week $COW liquidity mining program on @ethereum & @gnosis chain aginst $ETH and $GNO pairs.
COW tokens were airdropped to GNO holders based on the number of tokens held or staked during a snapshot that was taken back in early January, with 5% of COW tokens going to GNO holders who could receive an extra 5% if they had locked their GNO tokens on the protocol for a period of one year.
At the time of writing, COW has been listed on Uniswap and is trading at a price of $1.35.
MEV protection features add value to GNO and COW
The main draw of the CowSwap protocol is the MEV-protections offered that can help traders get better terms on swaps and avoid being front run or the victim of a sandwich attack.
What Ethereum people call “Miner Extracted Value” is what Bitcoiners call a game theory fail.
MEV = willfully frontrunning transactions, paying higher fees to do flash loans, sandwich attacks, etc.
It’s a mix between extortion, pickpocketing & perverse free market incentives.
Miner extracted value is a sort of “invisible” tax that occurs on the Ethereum (ETH) network where miners can increase their profitability by including, excluding or re-ordering transactions within the block they produce.
This feature allows miners to conduct certain exploits including front-running, back-running and transaction sandwiching, which help to increase profits at the expense of traders.
Future airdrops could give a long-term boost to GNO price
A third factor helping to boost the demand for GNO is the prospect of additional airdrops coming to GNO holders and stakers.
This includes an allocation of the soon-to-be-released SAFE token for Gnosis Safe, a platform in the Gnosis ecosystem that is designed to securely manage digital assets.
According to data from Dune Analytics, there is currently more than $77 billion worth of value held in Gnosis Safe contracts, a substantial amount that hints at the amount of trust various depositors have in the protocol.
Total USD value of assets stored in Gnosis Safe. Source: Dune Analytics
Documentation released by Gnosis Safe indicates that 20% of SAFE tokens will be distributed to the GNO community via direct distribution to GNO holders and a substantial deposit into the GnosisDAO treasury.
VORTECS™ data from Cointelegraph Markets Pro began to detect a bullish outlook for GNO on March 23, prior to the recent price rise.
The VORTECS™ Score, exclusive to Cointelegraph, is an algorithmic comparison of historical and current market conditions derived from a combination of data points including market sentiment, trading volume, recent price movements and Twitter activity.
VORTECS™ Score (green) vs. GNO price. Source: Cointelegraph Markets Pro
As seen in the chart above, the VORTECS™ Score for GNO began to pick up on March 23 and hit a high of 78 around nine hours before the price increased 78% over the next four days.
The views and opinions expressed here are solely those of the author and do not necessarily reflect the views of Cointelegraph.com. Every investment and trading move involves risk, you should conduct your own research when making a decision.
Bitcoin (BTC) and several altcoins surprised with their newfound strength during the weekend. Bitcoin’s rally easily sliced through the $45,900 level, which according to Glassnode was an area of resistance because several investors had purchased near that level when Bitcoin was declining after hitting its all-time high in November.
Bitcoin’s strength may have attracted buying in several altcoins, which are still languishing below their 52-week high. The rally in Bitcoin and the bottom fishing in altcoins has boosted investor sentiment, pushing the Crypto Fear and Greed Index into the “greed” territory.
Interestingly, the crypto markets have held a large part of their gains despite the tepid performance of the U.S. stock markets on March 28. This suggests that the crypto markets may be in the early stages of decoupling from the equity markets.
Could buyers sustain the momentum and clear the overhead resistance levels? Let’s study the charts of the top-10 cryptocurrencies to find out.
BTC/USDT
Bitcoin hesitated on March 26 as seen from the inside-day candlestick. This indicated indecision among the bulls and the bears. This uncertainty resolved to the upside on March 27 as the bulls regrouped and propelled the price above the overhead resistance at $45,400.
BTC/USDT daily chart. Source: TradingView
The sharp rally of the past few days has pushed the relative strength index (RSI) into the overbought zone for the first time since October 2021. This suggests that the momentum favors the buyers.
The bears may attempt to stall the up-move at the resistance line of the ascending channel but if bulls overcome this barrier, the BTC/USDT pair could rally to the psychological level at $50,000 and later to $52,000.
If the price turns down from the resistance line, the buyers will try to flip $45,400 into support. If they succeed, it will suggest that the up-move may continue. The bears will have to pull and sustain the price below $45,400 to weaken the bullish momentum.
ETH/USDT
Ether (ETH) broke above the symmetrical triangle on March 25 but the bulls could not sustain the higher levels. However, the buyers did not cede ground to the bears and resumed their purchase on March 26.
ETH/USDT daily chart. Source: TradingView
The momentum picked up on March 27 and the ETH/USDT pair has reached $3,411 where the bulls may encounter a minor resistance. If bulls bulldoze their way through, the ETH/USDT pair could rally toward the psychological level at $4,000.
Alternatively, if the price turns down from $3,411, the pair could retest the breakout level from the triangle. If the price rebounds off this level, it will suggest strong buying on dips. The bulls will then again try to resume the up-move.
The bears will have to pull and sustain the price inside the triangle to suggest that the bullish momentum may have weakened.
BNB/USDT
Binance Coin (BNB) continued its northward march and has reached the overhead resistance at $445. The bears are likely to defend this level with vigor.
BNB/USDT daily chart. Source: TradingView
The rising 20-day exponential moving average ($402) and the RSI near the overbought zone indicate that bulls are in control. If buyers thrust the price above $445, the BNB/USDT pair could rally toward the psychological level at $500. This level could again act as a strong resistance.
If the price turns down from $500 but does not break below $445, it will suggest that the bulls have flipped the level into support. That will increase the likelihood of a break above the overhead resistance.
Contrary to this assumption, if the price turns down from $445, the pair could drop to the 20-day EMA.
XRP/USDT
XRP turned up on March 26, indicating that bulls are buying on minor dips. The buyers pushed the price above the strong resistance at $0.86 but are facing resistance near $0.91.
XRP/USDT daily chart. Source: TradingView
Both moving averages are sloping up and the RSI is in the positive zone. If buyers do not allow the price to slide below $0.86, the prospects of a break above $0.91 increase. If that happens, the XRP/USDT pair could rally to the psychological level at $1.
This positive view will be invalidated if the price turns down from the current level or the overhead resistance at $0.91 and plummets below the moving averages. Such a move could pull the price to the strong support at $0.70.
ADA/USDT
Cardano (ADA) has continued its recovery and the price has reached the overhead resistance at $1.26 where the bears are likely to mount a strong defense.
ADA/USDT daily chart. Source: TradingView
The rising 20-day EMA ($1) and the RSI in the overbought zone suggest that bulls are in control. If the price turns down from overhead resistance but the bulls do not give up much ground, it will increase the possibility of a break above $1.26.
If that happens, the ADA/USDT pair could rally to $1.60 and then march higher toward $1.80. This bullish view will invalidate if the price turns down from the overhead resistance and breaks below the psychological level at $1.
LUNA/USDT
Terra’s LUNA token has been stuck in a tight range between the overhead resistance at $96 and the support at the 20-day EMA ($90). This tight-range trading could soon lead to a sharp trending move.
LUNA/USDT daily chart. Source: TradingView
The rising 20-day EMA and the RSI in the positive territory suggest that the path of least resistance is to the upside. If buyers propel and sustain the price above $96, the LUNA/USDT pair could retest the all-time high at $105.
This level is likely to act as a major obstacle but if bulls overcome it, the uptrend may resume. The pair could then rally to $125. This positive view will invalidate in the short term if the price turns down and breaks below the 20-day EMA. That could open the gates for a possible decline to $82.
SOL/USDT
After trading near the overhead resistance at $106 for a few days, Solana (SOL) broke and closed above the level on March 27. The moving averages have completed a bullish crossover and the RSI is near the overbought zone, indicating advantage to buyers.
SOL/USDT daily chart. Source: TradingView
If bulls sustain the price above $106, the SOL/USDT pair could rise to $122. The bears are expected to defend this level aggressively. If the price turns down from this level and breaks below $106, it will suggest that the pair may remain range-bound for a few more days.
The bulls will have to clear the overhead hurdle at $122 to signal the start of a new potential uptrend. The pair could then start its up-move which could reach the overhead resistance zone between $158 and $163.
Avalanche (AVAX) rebounded off the 20-day EMA ($83) on March 26, indicating that bulls are buying on dips. The buyers will now try to sustain the price above the immediate resistance at $92.
AVAX/USDT daily chart. Source: TradingView
If they succeed, the AVAX/USDT pair could rally to the overhead resistance zone at $98 to $100. This is an important zone for the bears to defend because a break and close above it could extend the rally to $120.
If the price turns down from the overhead zone, the bears will try to pull the pair to the moving averages. If the price rebounds off this level, the pair may remain stuck between the moving averages and the overhead zone for a few days.
DOT/USDT
Polkadot (DOT) picked up momentum on March 27 and has reached the stiff overhead resistance at $23. The upsloping 20-day EMA ($20) and the RSI near the overbought zone suggest that bulls have the upper hand.
DOT/USDT daily chart. Source: TradingView
If bulls drive and sustain the price above $23, the DOT/USDT pair could rally to $28. If bulls succeed in clearing this hurdle, the up-move may extend to $30 and later to $32.
Alternatively, if the price turns down from the overhead resistance, the bears will try to pull the pair to the 20-day EMA. A strong rebound off this support will suggest that bulls continue to buy on dips. That will increase the possibility of a break above the overhead barrier.
This positive view will invalidate if the price breaks below the moving averages. That could extend the consolidation between $16 and $23 for a few more days.
DOGE/USDT
The bulls flipped the 50-day simple moving average ($0.13) into support on March 25. This attracted strong buying in Dogecoin (DOGE), putting it on the path for a possible rally to $0.17.
DOGE/USDT daily chart. Source: TradingView
The moving averages are on the verge of a bullish crossover and the RSI is near the overbought zone, indicating that buyers have the upper hand. If bulls drive the price above $0.17, the DOGE/USDT pair could rise to $0.22.
If the price turns down from $0.17 but does not give up much ground, it will suggest that the traders expect the recovery to continue.
Conversely, if the price turns down sharply from the current level or the overhead resistance, it will signal that the pair may remain range-bound between $0.12 and $0.17 for a few more days.
The views and opinions expressed here are solely those of the author and do not necessarily reflect the views of Cointelegraph. Every investment and trading move involves risk. You should conduct your own research when making a decision.
Cointelegraph is following the development of an entirely new blockchain from inception to the mainnet and beyond through its series, Inside the Blockchain Developer’s Mind, written by Andrew Levine of Koinos Group.
Scalability is a popular topic in blockchain, but few ever explain what we mean by that term. When we at Koinos Group talk about scaling what we mean is scaling to the masses. Creating a blockchain that everyone on Earth can use. That means the blockchain network has to be able to support that level of load, which is typically what people mean when they refer to scalability.
User experience matters
But what they talk about far less is the obvious implication that you must have a user experience that everyone on Earth can find pleasurable. Terrible user experiences are infinitely scalable because there is no demand for bad user experiences and the underlying network resources required to deliver them.
This is demonstrated by the fact that when most projects talk about scaling, they talk about technical implementations like sharding, proof-of-history, or layer 2, which are the solutions that Ethereum is using to solve its scaling challenges.
These projects are responding to Ethereum’s scaling constraints by trying to integrate those scaling solutions sooner, but are failing to realize that those solutions only make sense in Ethereum’s context as not only the first general-purpose blockchain but the one with the most developer adoption in the world.
Ethereum: The first mover
When Ethereum was released, it gave developers, for the first time ever, the ability to develop applications on a shared blockchain platform using a programming language very similar to the ones they were already using to build applications; a Turing complete programming language. Compared to the developer experience of building applications on other blockchains, building on Ethereum was a quantum leap that made it faster, easier and cheaper to build decentralized applications. Thanks to this unparalleled user experience, the usage of Ethereum grew at a high rate. Demand for Ethereum’s resources has outstripped supply, which has led to an increase in demand for gas, and a corresponding price increase, making all Ether (ETH) holders very happy.
The Ethereum developers and stakeholders do not want to eliminate fees or even necessarily reduce them. That would be like oil producers wanting to reduce the price of oil. If there is surplus demand for their network resources, they don’t care about creating a better user experience, they care about increasing supply (scaling) while maintaining the existing user experience.
But that is Ethereum! The 900-pound gorilla of general-purpose blockchains with first mover advantage, incredible developer adoption and unfathomable capital investment. It is a successful platform and its plans for scaling make perfect sense for Ethereum. But they make no sense for platforms that have no usage and no developer adoption.
This is why we see so many projects pursuing labor intensive and risky efforts like bridges to Ethereum in an attempt to siphon users off of Ethereum to trigger the growth they need to justify their scaling solutions!
Reasoning from analogy
But this is classic reasoning from analogy as opposed to reasoning from first principles; making decisions based on what everyone else is doing instead of focusing on the problem you want to solve and the most efficient path for developing a solution based on fundamental truths. Thinking that the way to scale a new blockchain is sharding because sharding is the way to scale Ethereum is a perfect example of reasoning from analogy.
At Koinos Group, we’re approaching this problem from first principles. Scaling to the masses is not about integrating some magical technology that overnight supports everyone and their mother. No technology platform ever goes from zero users to mass adoption overnight. Every platform or product that reaches mainstream adoption only ever achieved that through exponential growth. I’ll repeat that. Every product or platform reaches mass adoption through exponential growth.
What that means is that it doesn’t matter how many users or how many transactions your platform or application stack can handle on Day One. That is effectively irrelevant.
What matters the most is that your product has some unique value proposition that a small number of early adopters will love, even if the cost is relatively high. Koinos allows people to use decentralized applications for free simply by holding liquid KOIN tokens in their wallets. They don’t have to buy an account or consciously stake their tokens because every liquid KOIN token contains mana that is consumed down when they use the blockchain. As an account’s mana gets consumed, the tokens containing that mana are automatically locked for some time, creating an opportunity cost instead of an explicit fee.
Video game experience
This gives the blockchain a video game-like user experience, instead of the unpleasant UX of every other blockchain. This delivers a fundamentally different, and more pleasant user experience, but it’s not like the whole world is going to want to use Koinos on Day One. Ethereum’s fee-based model is still the dominant paradigm, which is only validated by its many imitators/competitors. It also has an army of developers, token holders and institutional investors advocating for it (and by extension, its fee-based model).
On Day One, a relatively small group (hopefully, not too small) of early adopters looking for the next best thing will begin using Koinos. The mainnet needs to be able to give those people a pleasant user experience, but no more. As those people use the blockchain and discover that it truly has a delightful user experience, they will spread the word, and usage of the blockchain will go up.
At a certain point, the usage of Koinos will get high enough that the amount of a user’s tokens getting locked is very high and the new user experience relative to the original user experience might be unacceptable. This is what Koinos hitting its scaling constraints looks like. But bear in mind, the user is still not losing those tokens forever (a fee), they are only sacrificing some opportunity cost, which is an infinitely better user experience.
Upgradeability: The ultimate scaling solution
Koinos has to be engineered so that as adoption grows, the right scaling technologies can be integrated at the right time. This is why Koinos is not optimized for any particular scaling solution, but upgradeability in general, making it as easy as possible for new technologies to be added once they have been sufficiently battle-tested. This turns all of the other projects experimenting with scaling technologies prematurely into fertile testing grounds for Koinos!
Scaling is not an end goal, it’s a process that unfolds throughout the lifetime of a platform, at least, if the platform is sufficiently upgradeable. If the platform isn’t sufficiently upgradeable then you have to pick the “right” scaling solutions on Day One, even if you don’t need it, but this is more of a reflection of poor upgradeability (and bad engineering) than anything else.
This is why I like to say that upgradeability is the ultimate scaling solution.
This article does not contain investment advice or recommendations. Every investment and trading move involves risk, and readers should conduct their own research when making a decision.
The views, thoughts and opinions expressed here are the author’s alone and do not necessarily reflect or represent the views and opinions of Cointelegraph.
Andrew Levine is the CEO of Koinos Group, a team of industry veterans accelerating decentralization through accessible blockchain technology. Their foundational product is Koinos, a feeless and infinitely upgradeable blockchain with universal language support.
The Brazilian city of Rio de Janeiro will officially start accepting Bitcoin (BTC) payments for taxes related to urban real estate within their city limits, a.k.a. Imposto sobre a propriedade predial e territorial urbana (IPTU).
As reported by Cointelegraph Brazil, the new pro-crypto tax laws will be implemented from 2023, which was announced by the Secretary of Economic Development, Innovation and Simplification, Chicão Bulhões.
Supporting this cause led by the Brazilian Mayor Eduardo Paes, Binance CEO Changpeng Zhao announced to open a new office in the region stating that “He’s done his part. We are working on ours.”
9 days ago, I made a handshake deal with mayor @eduardopaes. Rio De Janeiro will accept crypto for tax payments, and @Binance will open an office in Rio. He’s done his part. We are working on ours. https://t.co/HPJONtBfQ8
The rollout of this initiative will place Rio de Janeiro as the first Brazilian city to mainstream BTC payments. According to the translated announcement:
“To enable the operation, the municipality will hire companies specialized in converting crypto assets into reais. In this way, the City Hall will receive 100% of the amount in the currency.”
Brazilian secretary Pedro Paulo further acknowledged that the city’s goal — with the acceptance of cryptocurrencies — is to develop a solid market of this new asset class in the city, adding:
“We will stimulate the circulation of cryptocurrencies by integrating them into the payment of taxes, as in the case of IPTU and, in the future, this can be expanded to services such as taxi races, for example.”
The city also plans to involve nonfungible tokens (NFT)-based governance policies across various markets including arts, culture and tourism.
Earlier this year on Jan. 29, Meta, the world’s biggest social media platform, filed a trademark registration with the Brazilian authorities to design, develop and provision hardware and software for various BTC and crypto-related services.
Meta’s trademark filing with the Brazilian INMI. Source: INPI
As Cointelegraph reported, Meta’s trademark filing order was placed on Oct. 5, 2021, from Jamaica.
Filling multiple needs within the cryptocurrency community is one way a project can set itself apart from the competition and new attract users and liquidity to its ecosystem.
Loopring aims to do exactly this by aiming to offer a EVM-based solution with low fees where DeFi and NFT developers and investors can transact. The layer-two (L2) scaling solution utilizes zk-Rollups to provide fast, low-cost transactions and the project has been gaining traction throughout the month of March.
Data from Cointelegraph Markets Pro and TradingView shows that the price of LRC gained 57% between March 21 and March 23 as its price increased from $0.78 to $1.23 amidst a spike in its 24-hour trading volume to $2.75 billion.
LRC/USDT 4-hour chart. Source: TradingView
Three developments that have helped spark the reversal in price for LRC include the beta launch of the GameStop NFT marketplace on the Loopring network, the inflow of new users and a rapidly expanding NFT ecosystem.
GameStop selects Loopring for its upcoming NFT Marketplace
The most significant recent development that helped to drive the increase in demand for LRC was the March 23 announcement that GameStop has integrated the beta version of its NFT marketplace with the Loopring network.
The future of #NFTs are here + they’re powered by #Ethereum‘s second layer
GameStop reports that it chose Loopring to host its NFT marketplace due to the network’s ability to mint NFTs for a fraction of the cost required on Ethereum, with the average fee being less than $1.
Beta users can begin exploring the marketplace now and deposit funds in preparation for the platform’s full lauch which is expected to take place in the near future.
Surging user growth
A second factor putting wind in the sails of LRC has been the surge in new users in the Loopring ecosystem as evidenced by the record-high number of wallets joining the netw.
Total number of Loopring wallets. Source: Dune Analytics
According to data from Dune Analytics, the wallet count of the Loopring network has increased from 6,498 on Oct. 30, 2021 to an all-time high of 27,092 on March 25 as the GameStop announcement helped initiate a new of wave users.
The recent release of the Loopring Smart Wallet, which includes the ability to mint NFTs and retrieve a lost account via social recovery and Guardians, has also helped in the process of onboarding new users and wallets in the ecosystem.
A third factor helping to boost the outlook of LRC is the overall growth of its ecosystem which includes a NFT community that has already seen more than 1 million NFTs minted.
Over 1 Million NFTs have been minted on Loopring L2 since the launch of open #NFT minting less than a month ago
Further evidence of its growth can be found looking at the daily volume traded on Loopring, which experienced a significant spike in activity following the March 23 GameStop announcement.
Loopring volume traded per pair per day. Source: Dune Analytics
VORTECS™ data from Cointelegraph Markets Pro began to detect a bullish outlook for LRC on March 20, prior to the recent price rise.
The VORTECS™ Score, exclusive to Cointelegraph, is an algorithmic comparison of historical and current market conditions derived from a combination of data points including market sentiment, trading volume, recent price movements and Twitter activity.
As seen in the chart above, the VORTECS™ Score for LRC climbed into the green zone on March 19 and proceeded to hit a high of 88 on March 20, around 40 hours before the price increased 57% over the next two days.
The views and opinions expressed here are solely those of the author and do not necessarily reflect the views of Cointelegraph.com. Every investment and trading move involves risk, you should conduct your own research when making a decision.